The Smplrspace logo in dark blue color.
Platform
platform
Interactive 2D & 3D floor plans

Rapid floor plan digitization

Reporting & business intelligence

Contextualize any type of data

Integrate & embed Smplrspace

Control interactions, UX, and data

Real estate portfolio digitization

Portfolios in real-world context

Services
Floor plan digitization

Digitization services

Data mapping

Mapping of spatial entities

Solutions
By organization
Owners & operators

Portfolio-wide intelligence

Software companies

Interactive digital floor plans

By asset type
Retail

Spatial retail insights

Commercial office

Smarter office decisions

Multifamily

Unit-to-portfolio clarity

Resources
Two business executives seated at a table in a modern office, reviewing documents with a large screen displaying a 3D city map behind them through the Smplrspace application.
Why Smplrspace

Learn why Smplrspace is the visual canvas your real estate portfolio can rely on.

Learn more
Help center

Practical guides and insights

Support

Reach out to our support team

What's new

Product updates

System status

Platform performance

Developers
Two developers discussing a Smplrspace integration in a modern office with other programmers working nearby.
Quickstart guide

A practical starting point for developers new to Smplrspace.

Learn more
Developer docs

Starting point for developers

API reference

All available APIs

Live integration examples

See Smplrspace in action

Pricing
Log inContact sales
Contact sales
Reporting & business intelligence

Business intelligence for commercial real estate

See real estate data in spatial context across buildings and portfolios, with clarity that spreadsheets and dashboards can’t deliver.

Contact sales
3D floor plan of an office space with various rooms and open areas featuring red and green chairs and tables displaying booking status.
3D floor plan of a retail mall floor with areas color-coded in green, red, and orange to indicate different leasing statuses.
A snippet from a leasing report showing occupancy metrics.3D model of a tall building with colored sections in green, orange, and red, turning the building into an interactive stacking plan, on a city map near water.
Gradient color scale labeled Gross rent from 1K to 100K.Financial summary showing monthly gross rent, PSF, smallest leased area, largest leased, and lease details for B2, B1, and L1 floors with leases, square footage, and rent amounts.3D floor plan of a building level with various sized rooms and corridors, some shaded in blue and white, showcasing occupancy and footfall data.
3D digitized building representing occupancy levels with stacked units in shades of blue and white.
Overhead layout of a parking lot with regular, handicapped, and electric vehicle parking spaces marked in red and green, showcasing parking current capacity.
3D floor plan map with color-coded heatmap indicating temperature levels, showing warmer zones in red and yellow, cooler zones in blue.
See your data where it happens

Spatial business intelligence across your portfolio

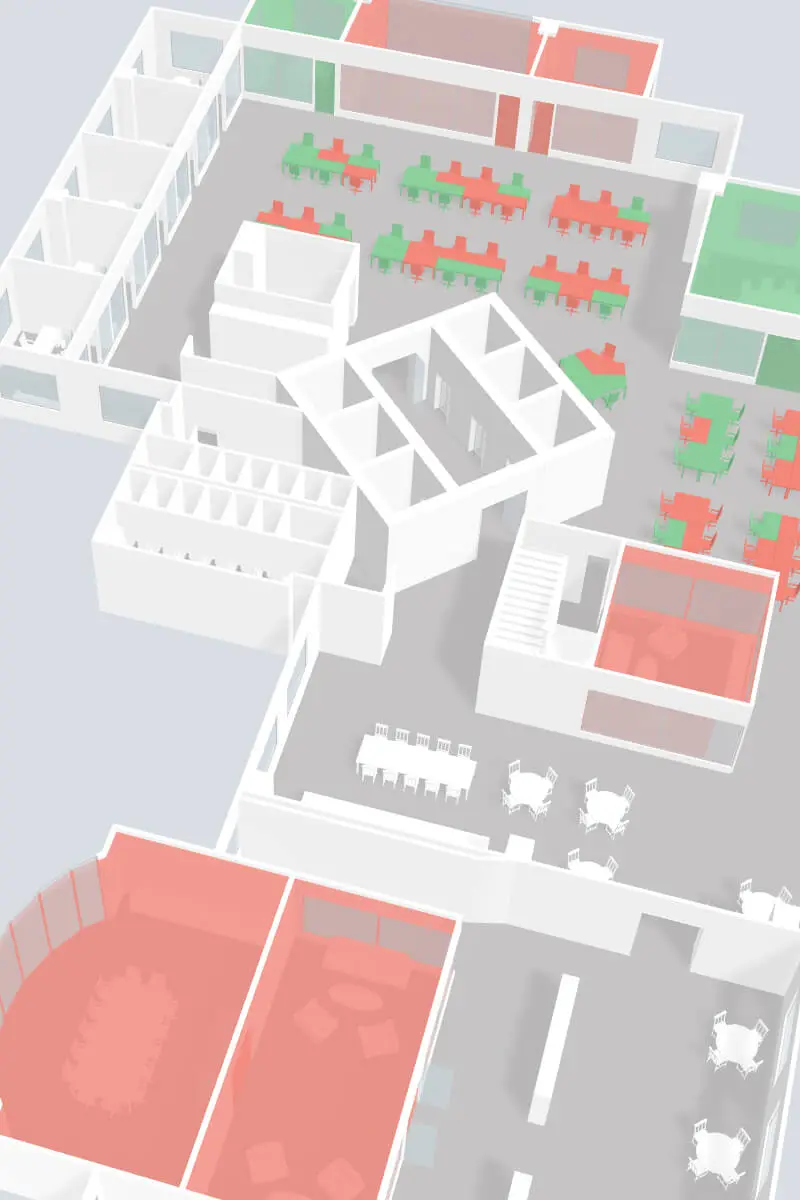
Visualize any building-related data, from any source, directly on floors, buildings, and portfolios. Reporting is embedded into your property, not separated from it.

Instead of reviewing charts or spreadsheets in isolation, teams can:

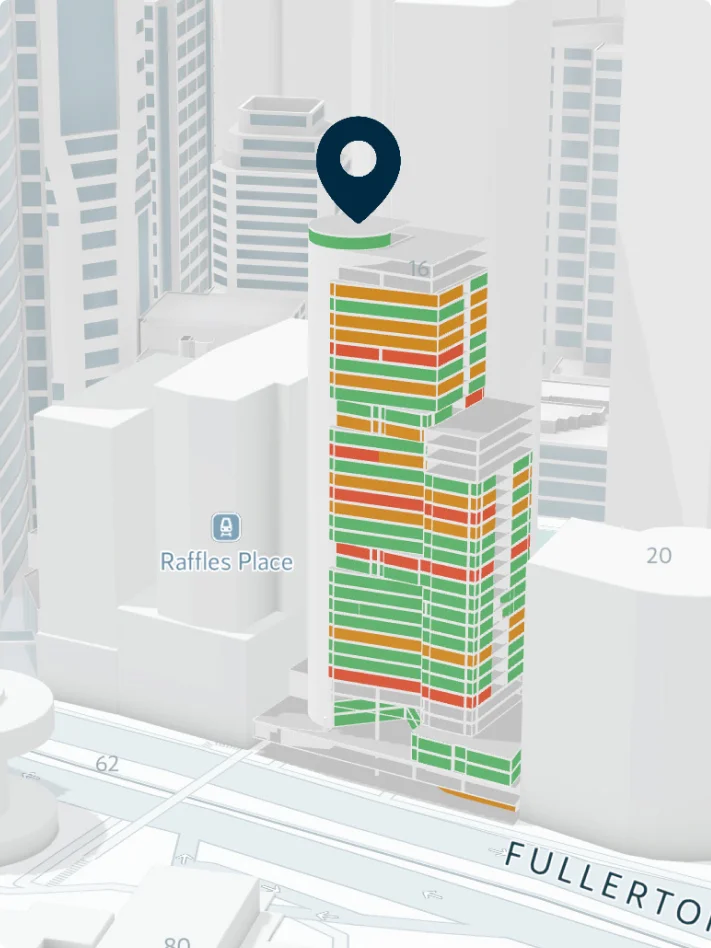
See critical data directly on the buildings

Understand impact and proximity within buildings

Compare performance across sites and regions

Move seamlessly from unit-level details to portfolio level insights

Real estate team in a modern conference room looking at a dashboard view of a rent roll report with a 3D floor plan showing colored lease areas by monthly gross rent values..
Built for every real estate team

One platform, many perspectives

Smplrspace reporting supports operations, leasing, asset management, and leadership in the same environment.

Each team works with data and configured filters that matter to them, while staying aligned through a shared spatial view of the portfolio.

Where insight turns into action

Reporting that drives real decisions

Smplrspace is a single solution shareable with management and multiple teams for operational efficiency and reporting.

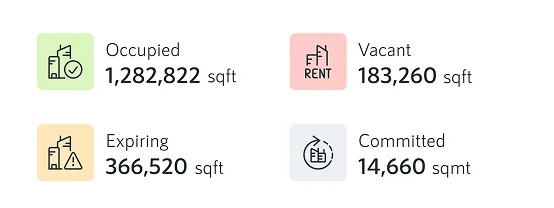
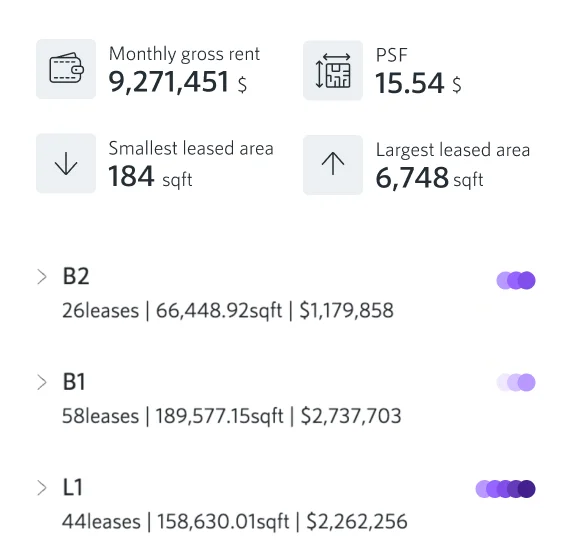
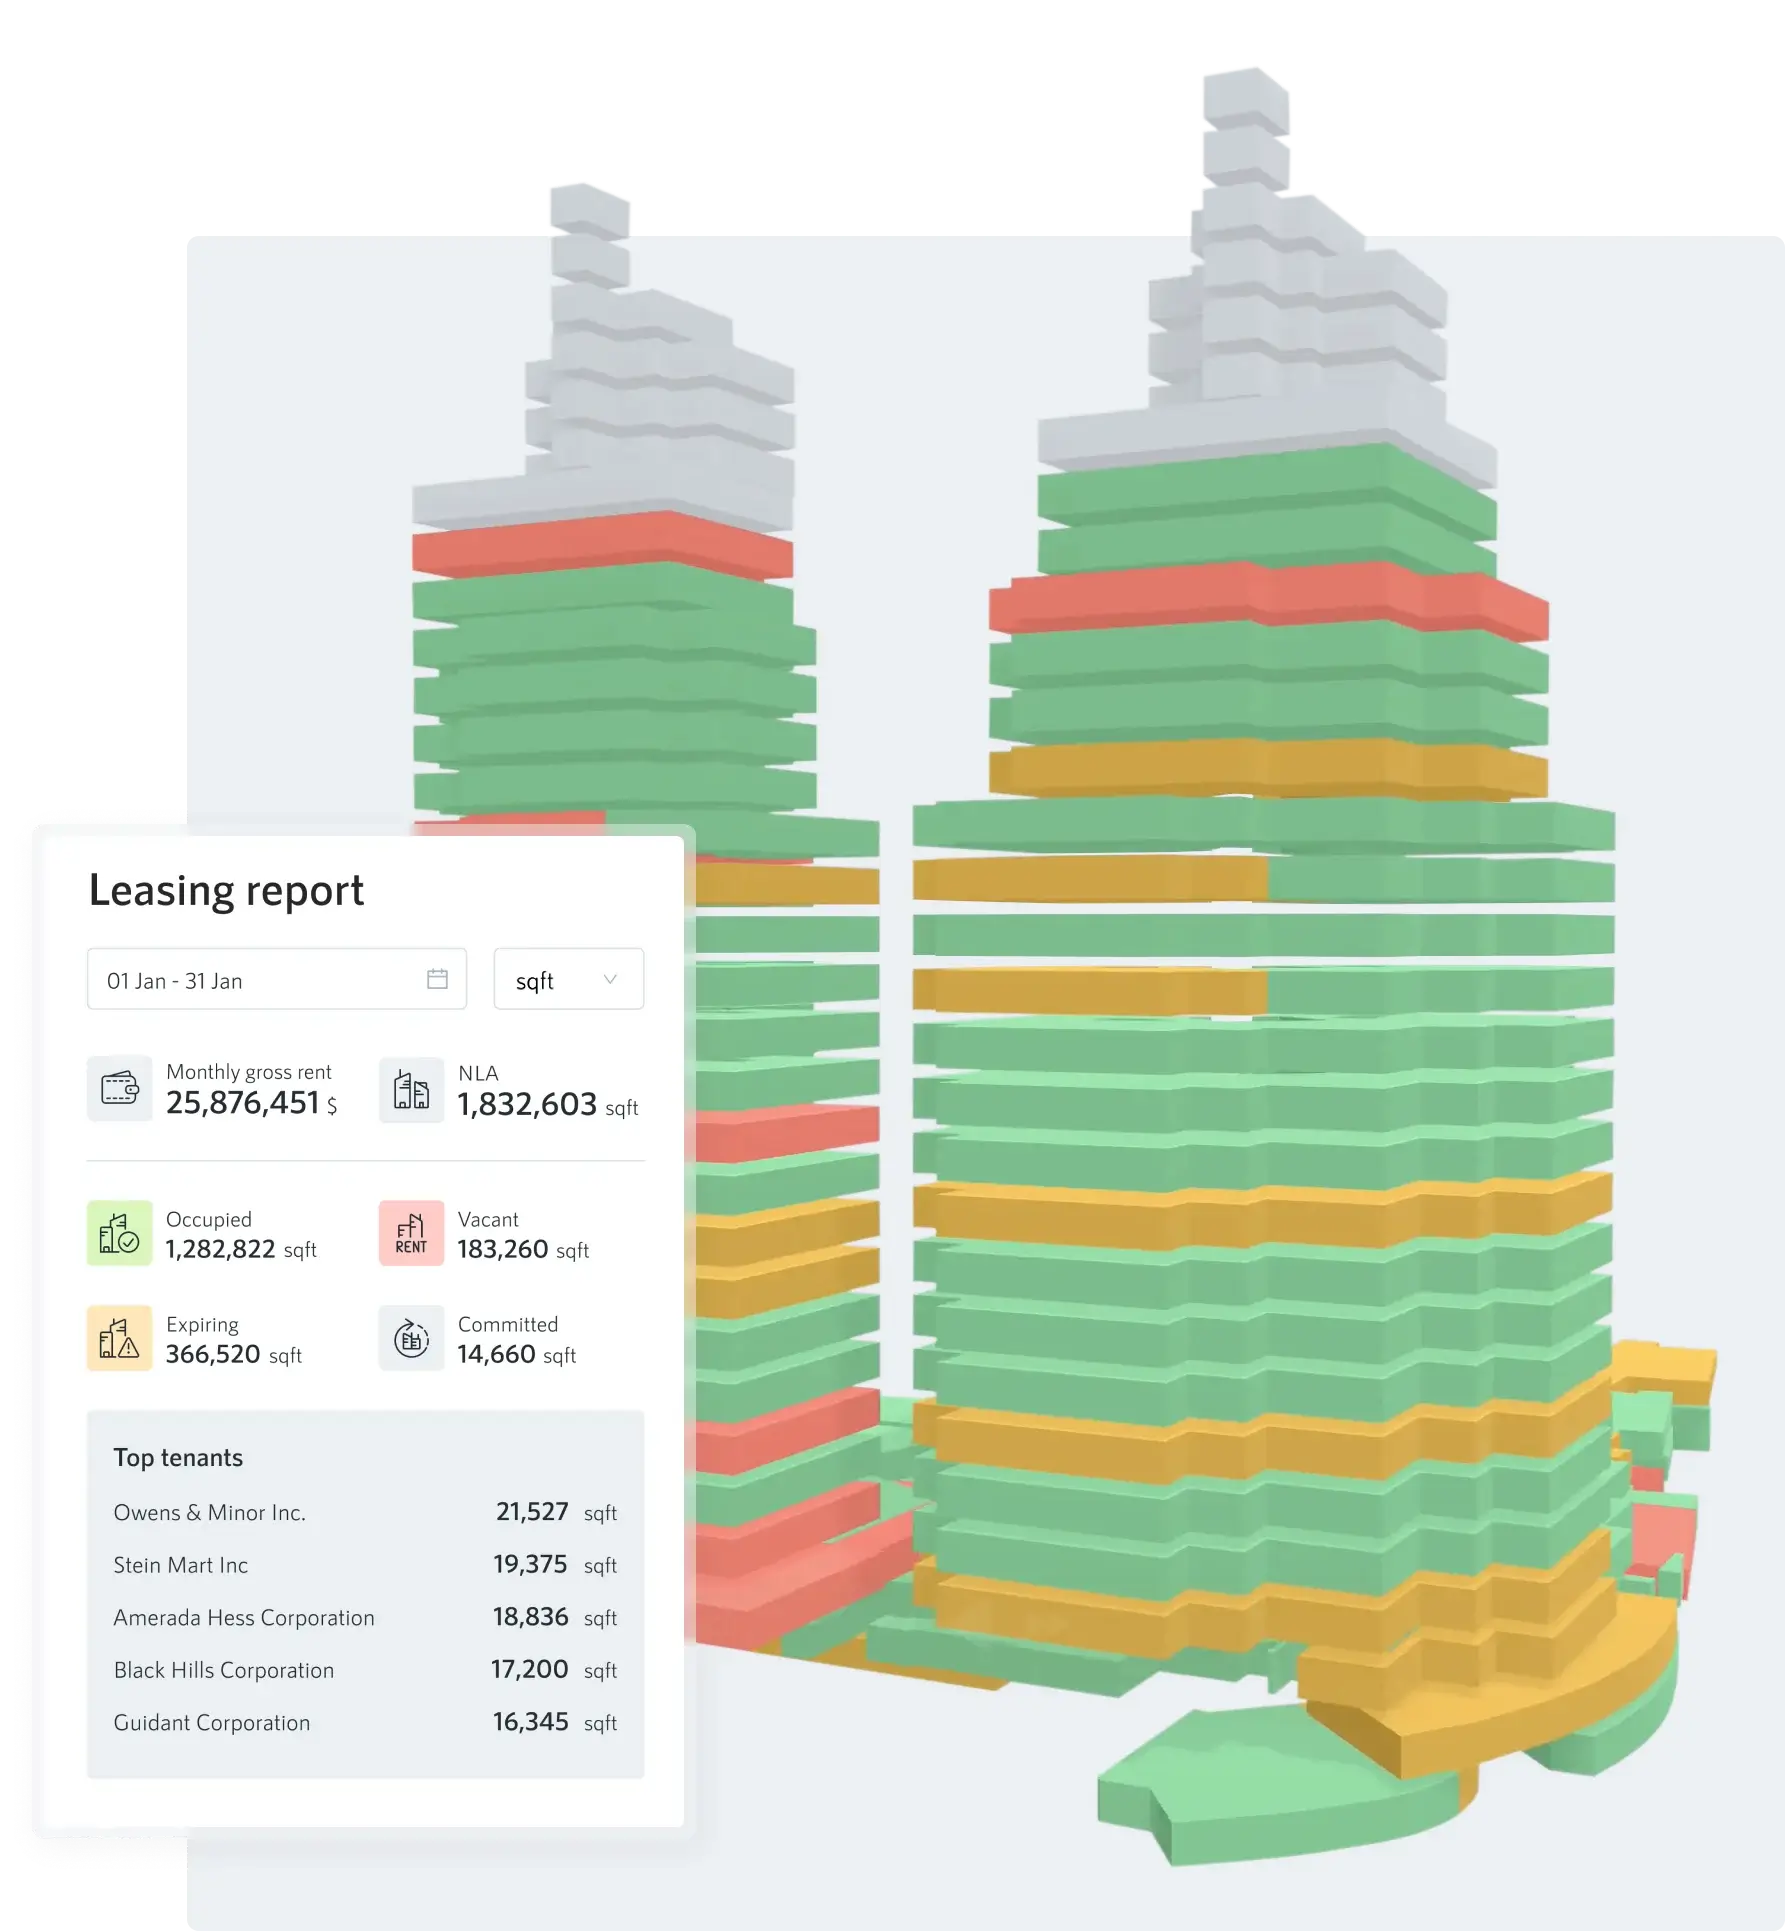
Leasing, tenancy & rent

See availability, tenant mix, and rent in spatial context. Compare units, track leasing status, and support faster, clearer leasing decisions across buildings and portfolios.

3D building model with color-coded floors indicating leasing status alongside a leasing report showing monthly rent, net leasable area, occupied, vacant, expiring, committed space, and top tenants with square footages.

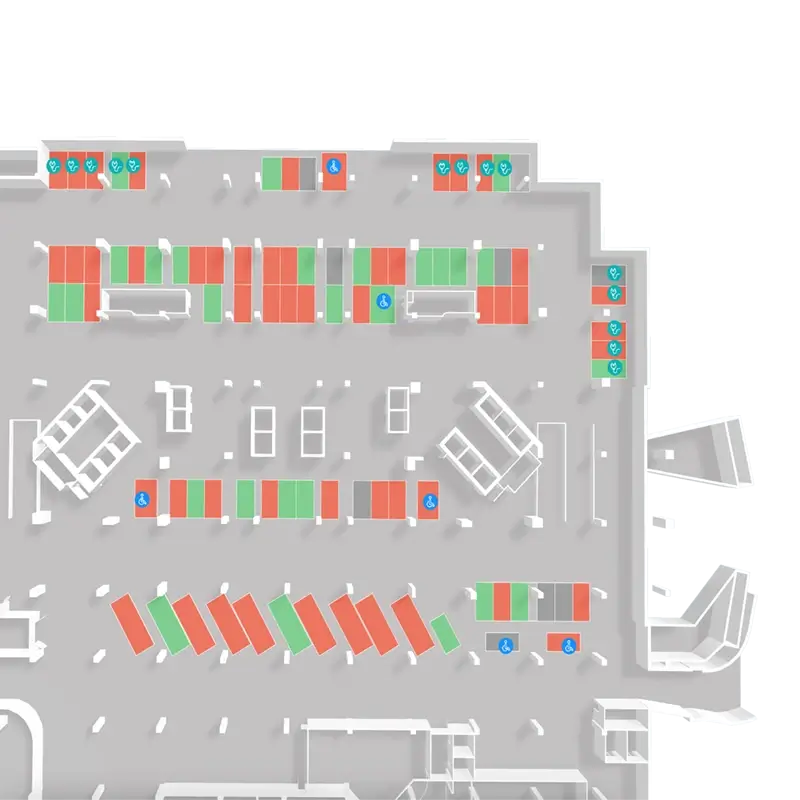
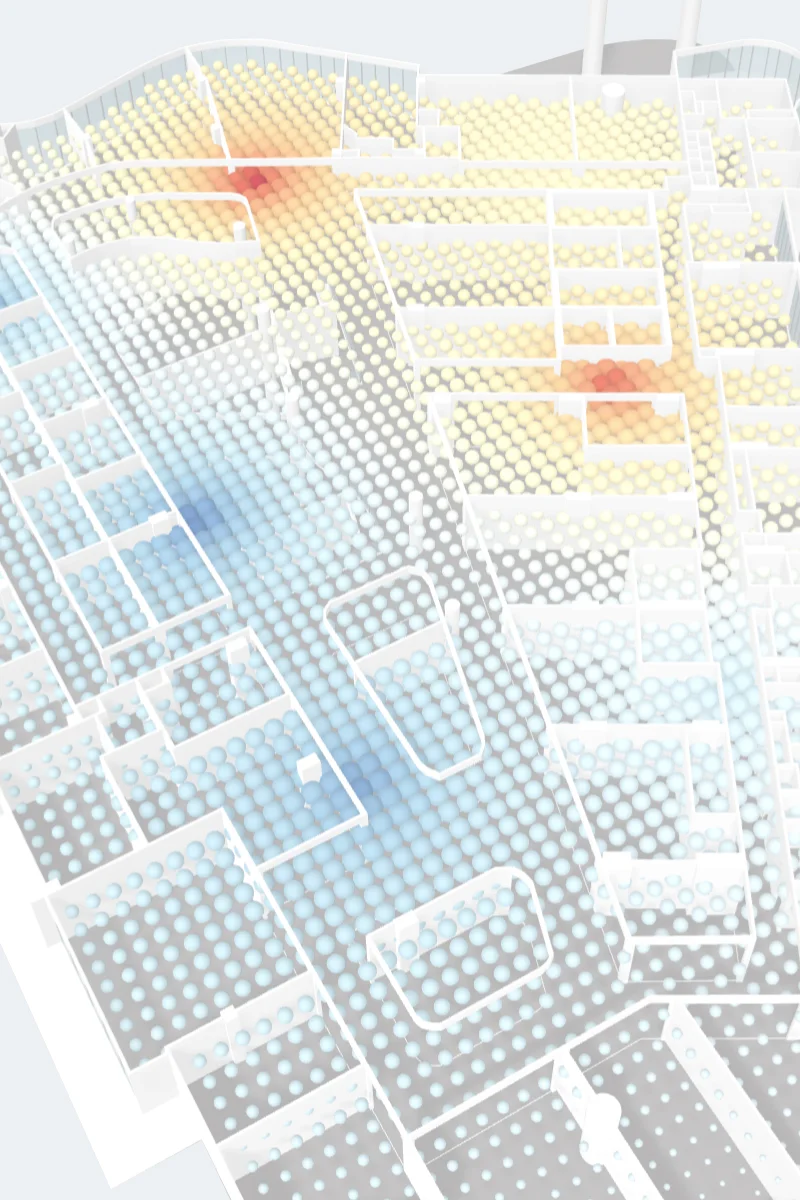
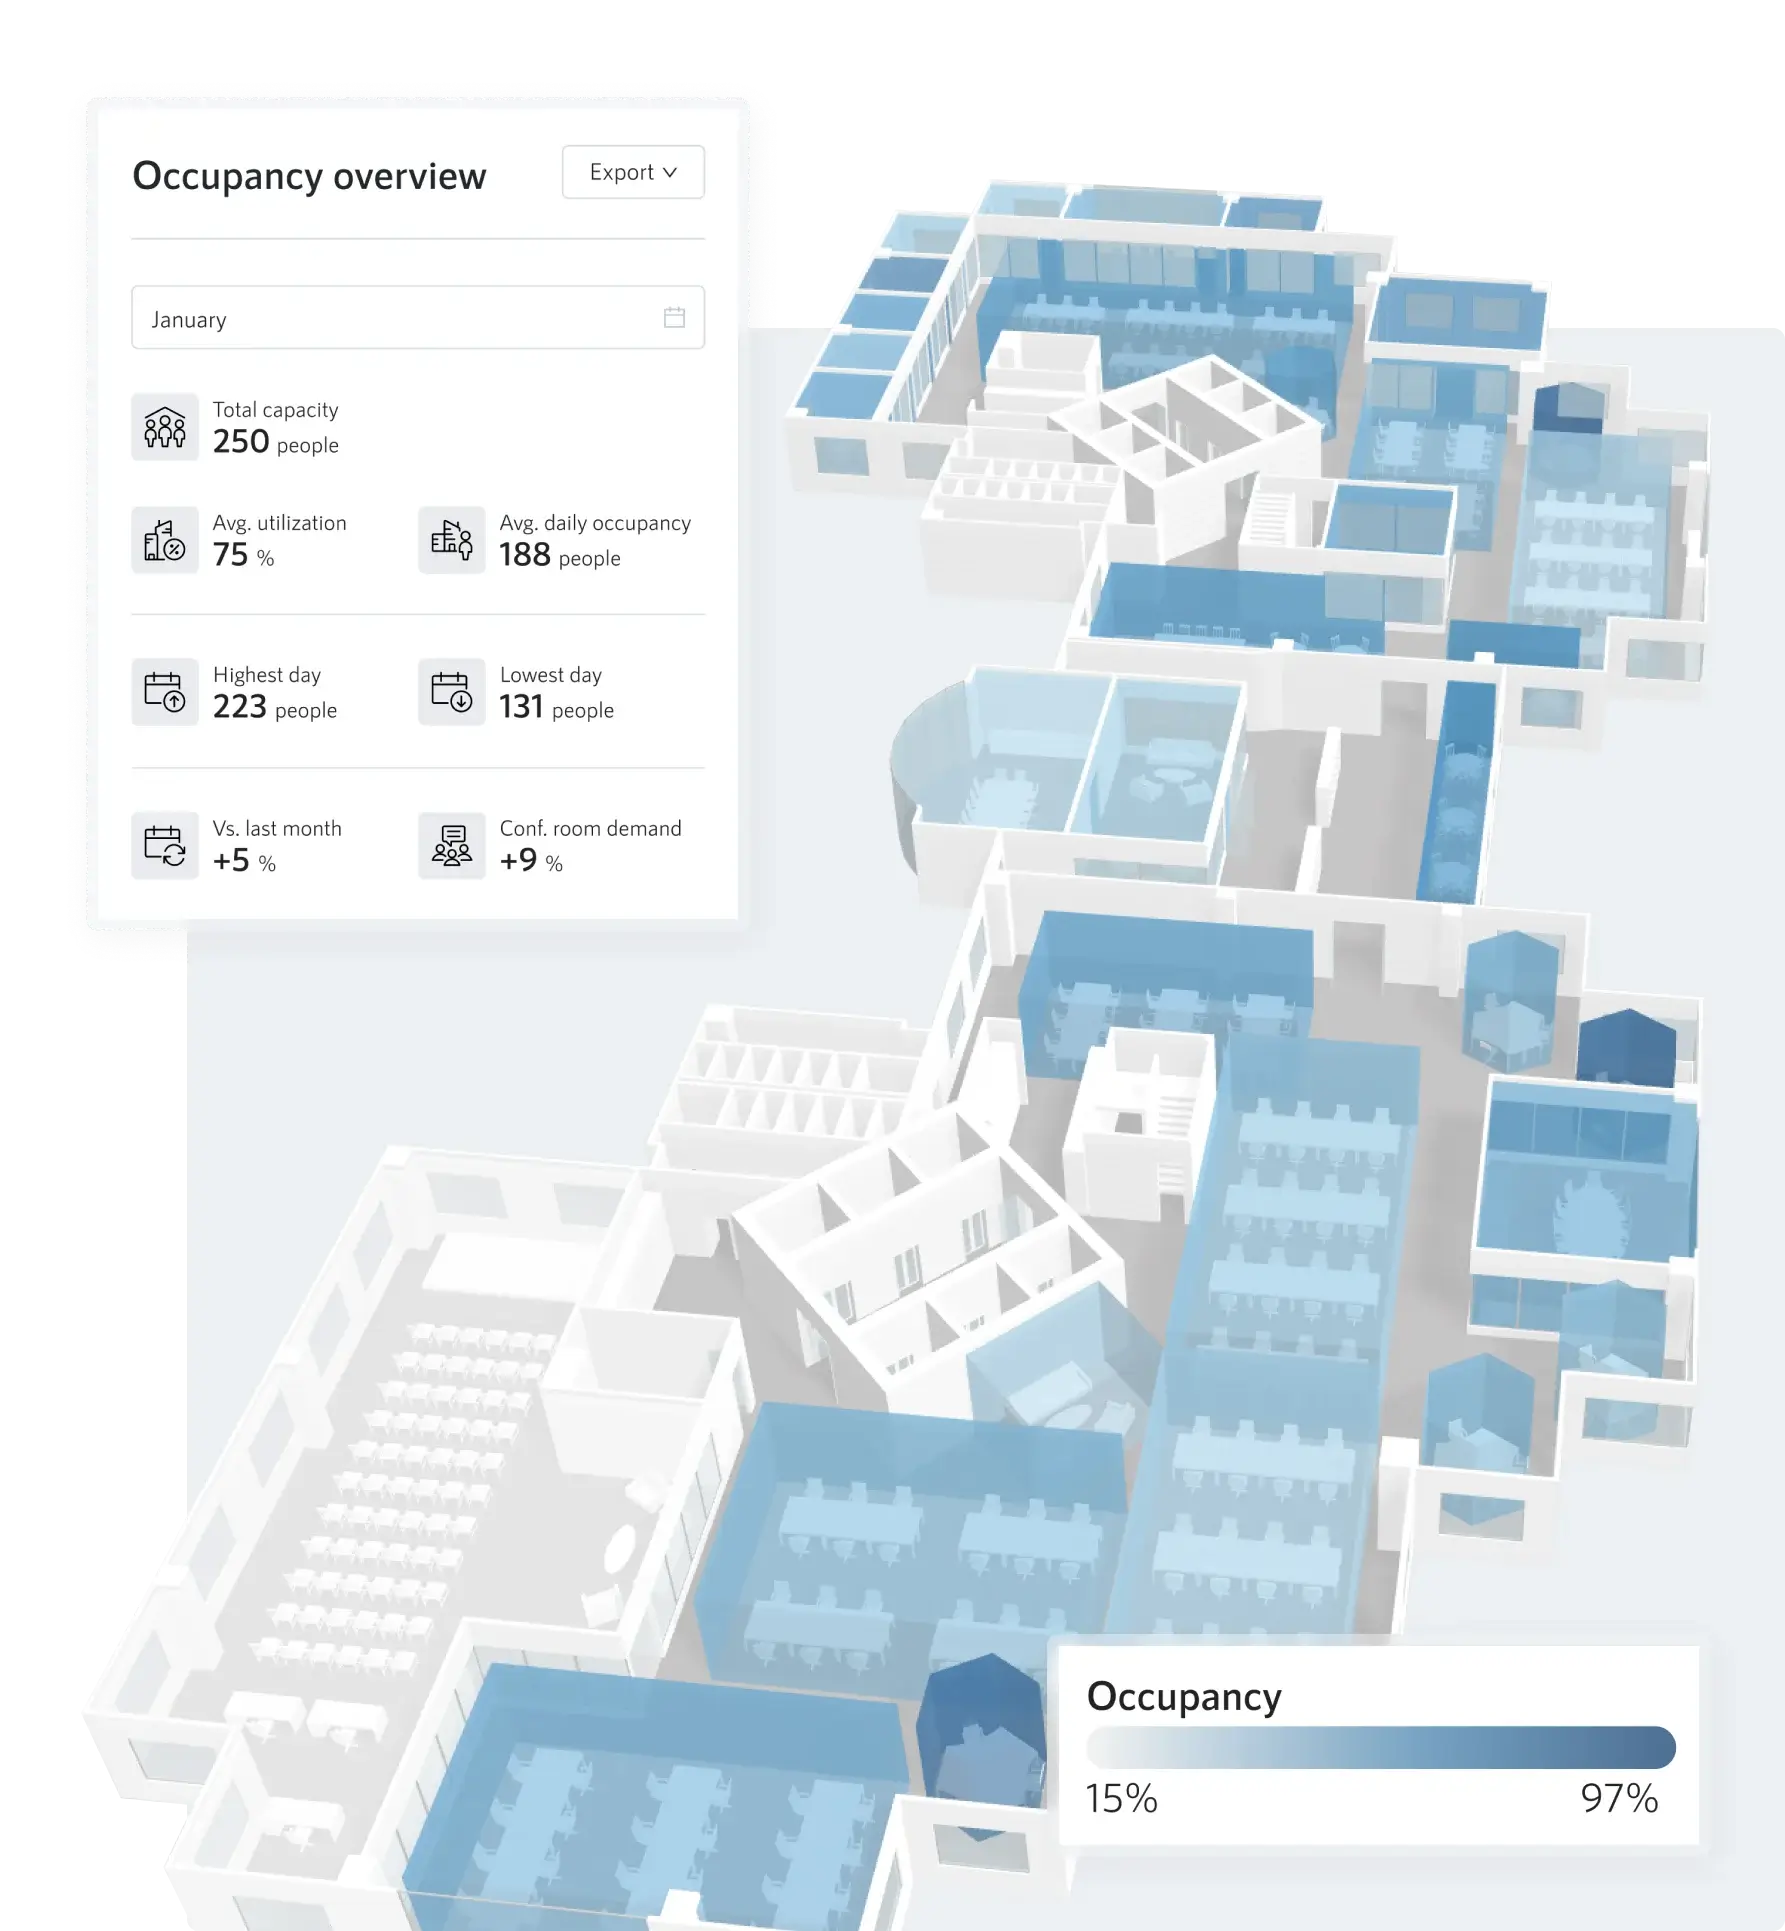
Space usage & occupancy

Understand how space is actually used. Identify underutilized areas, congestion, and opportunities to optimize layouts and capacity.

3D floor plan highlighting office occupancy with blue shaded areas and a panel showing occupancy metrics such as total capacity, average utilization, and highest/lowest occupancy days for January.

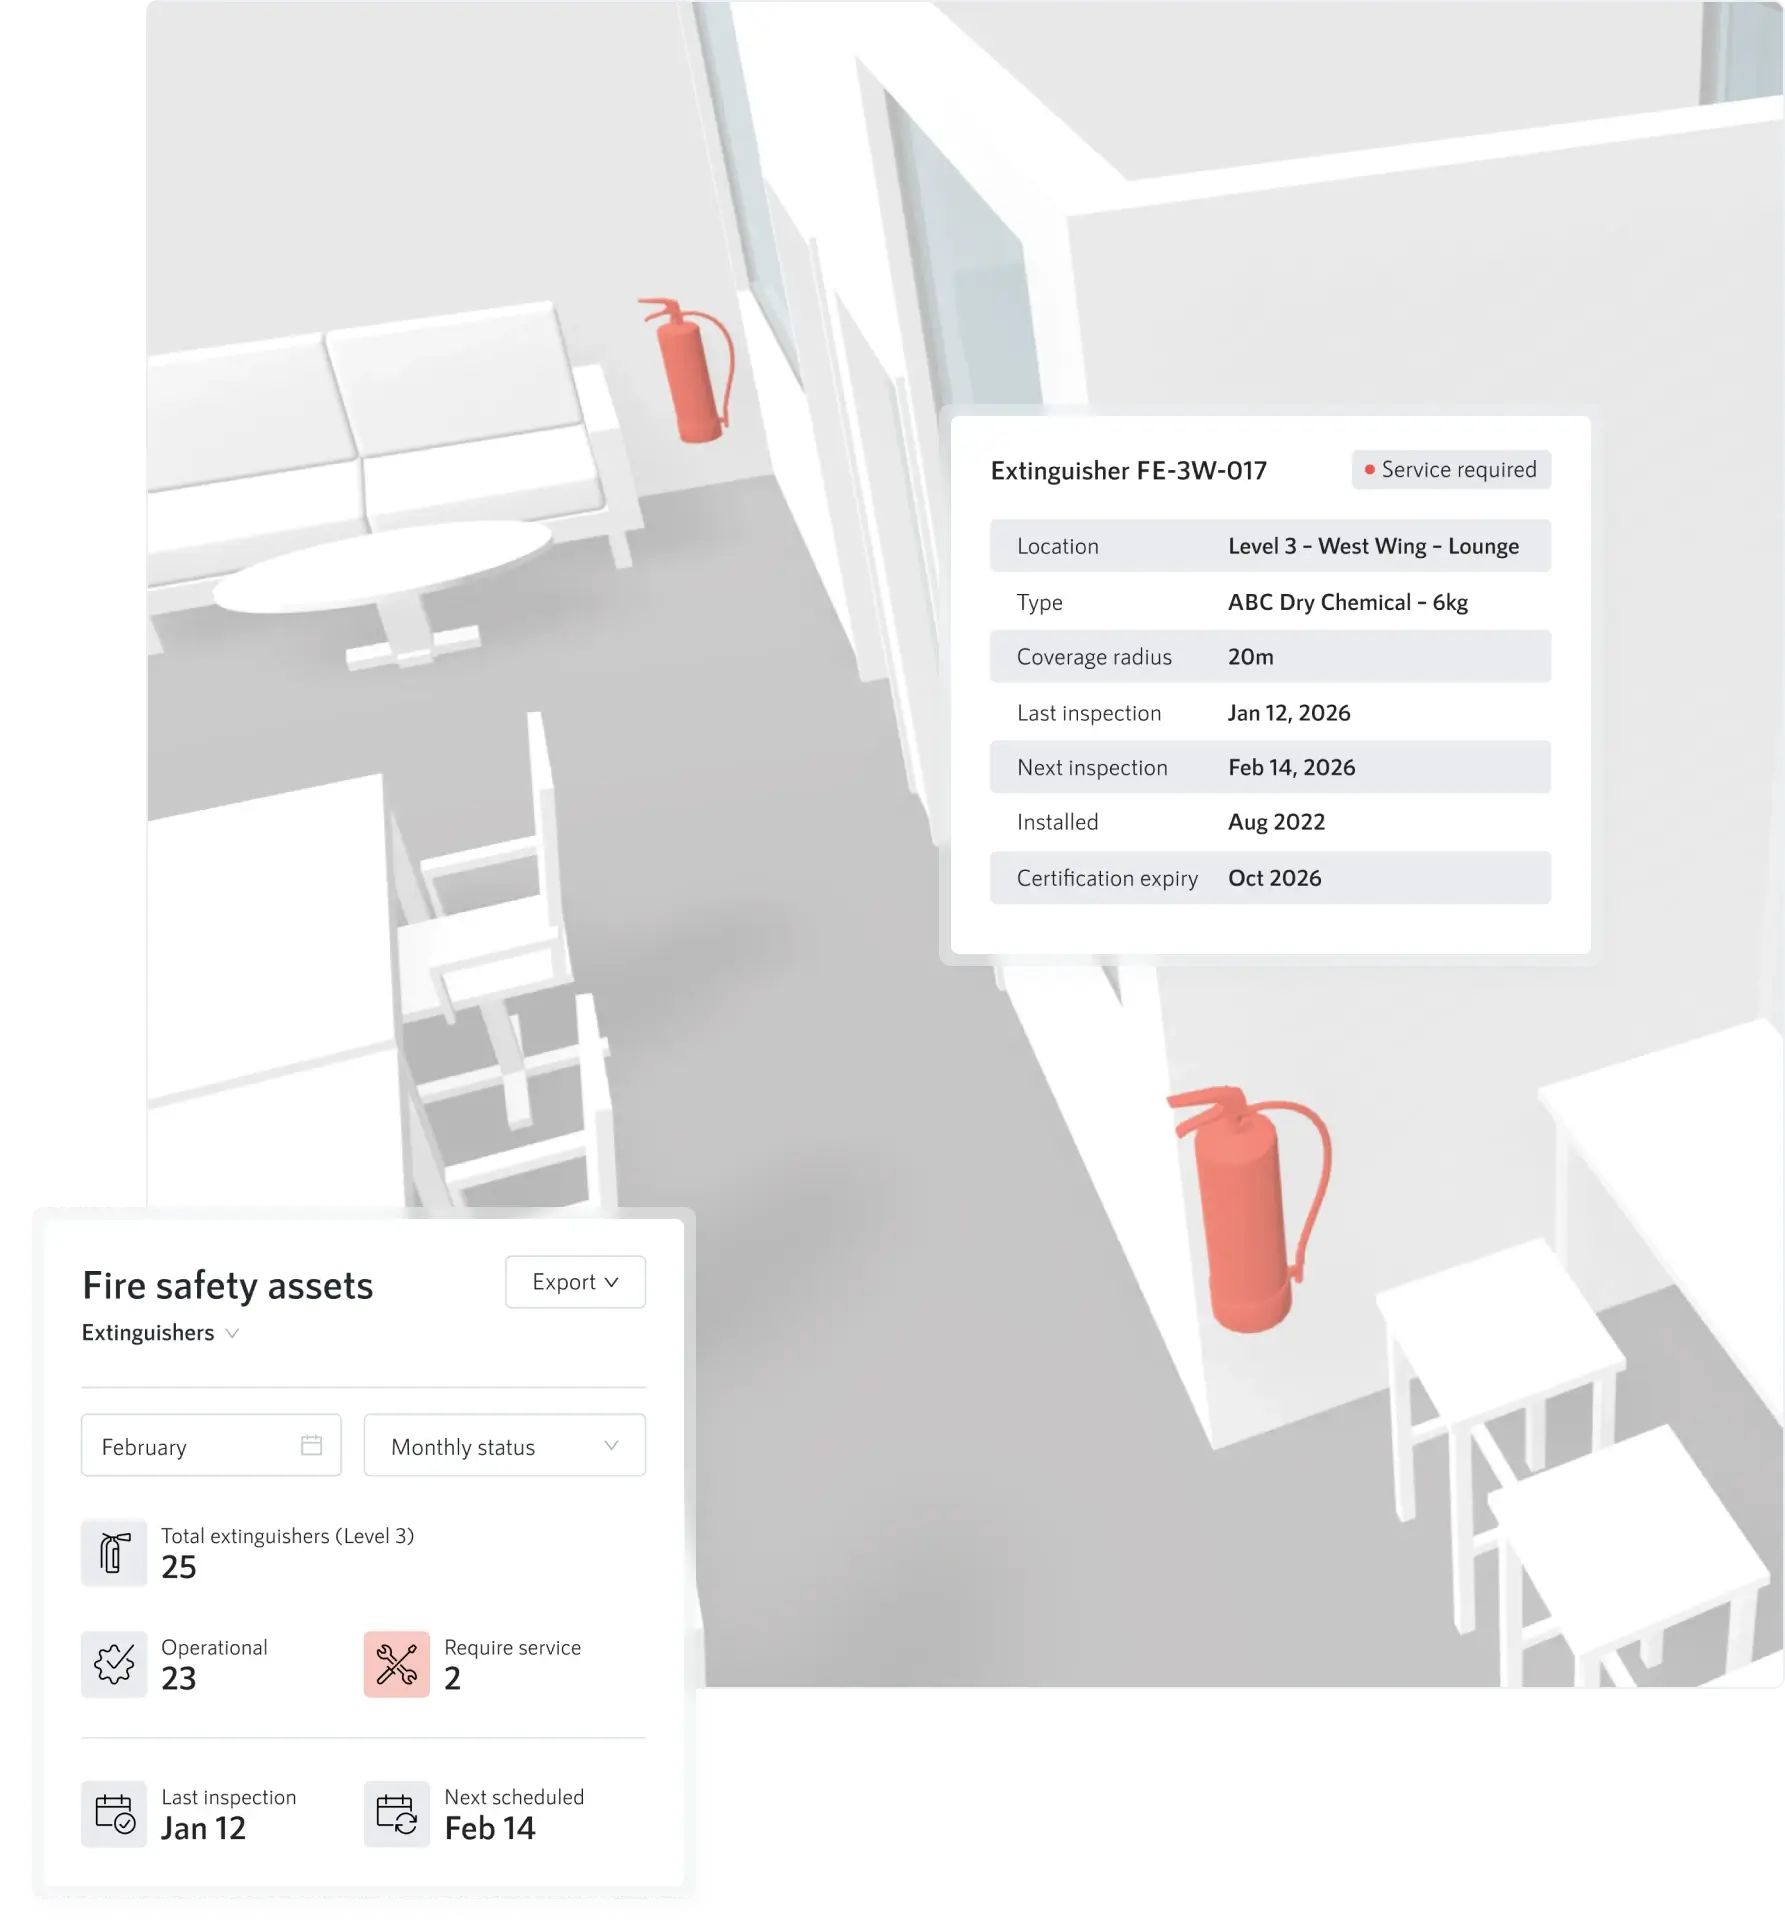
Facilities & asset management

Track assets, equipment, and systems where they exist. See distribution, condition, and lifecycle across spaces and buildings at a glance.

3D overview of a lounge area with fire extinguishers marked in red and detailed fire safety asset information including inspection dates and service status.

Operations & maintenance

Prioritize issues with context. Spot patterns, understand impact, proximity, and urgency to plan maintenance more effectively and reduce reactive work.

Digital 3D floor plan of an office with a surveillance camera highlighted showing details including location, reporting period, tracked incidents, downtime, resolution time, service actions, inspections, installation date, and warranty validity, alongside an events calendar for various dates.

Sales & business development

Understand portfolio performance, vacancy, and positioning. Use spatial insight to identify opportunities, support pricing decisions, and improve sales effectiveness across buildings and regions.

3D map of buildings in New York with real estate data including net leasable area, occupancy, vacancy, average contracted rent, lease expiry, and largest block size.
3D building model with color-coded floors indicating leasing status alongside a leasing report showing monthly rent, net leasable area, occupied, vacant, expiring, committed space, and top tenants with square footages.
3D floor plan highlighting office occupancy with blue shaded areas and a panel showing occupancy metrics such as total capacity, average utilization, and highest/lowest occupancy days for January.
3D overview of a lounge area with fire extinguishers marked in red and detailed fire safety asset information including inspection dates and service status.
Digital 3D floor plan of an office with a surveillance camera highlighted showing details including location, reporting period, tracked incidents, downtime, resolution time, service actions, inspections, installation date, and warranty validity, alongside an events calendar for various dates.
3D map of buildings in New York with real estate data including net leasable area, occupancy, vacancy, average contracted rent, lease expiry, and largest block size.

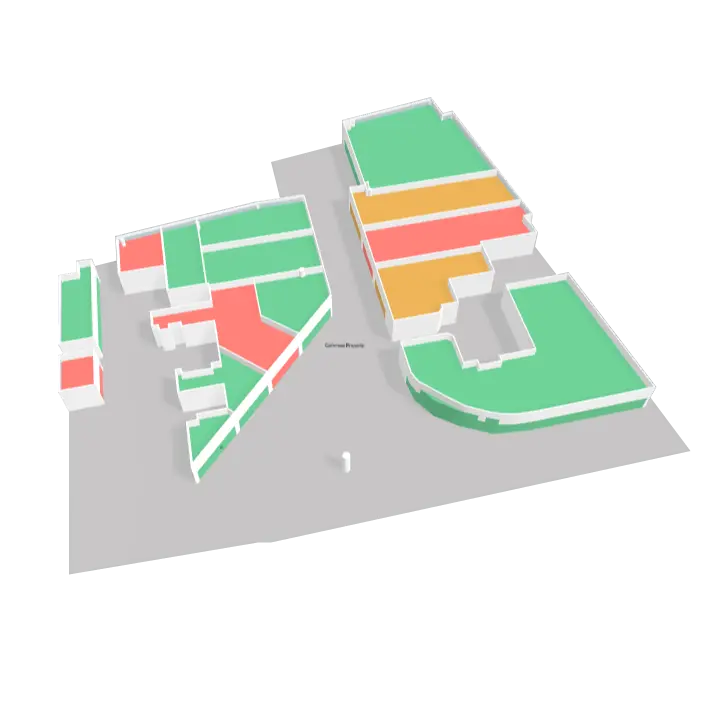
Portfolio and outdoor reporting across sites

Portfolio manager in a gray suit showcasing properties on 3D outdoor map on a large screen in a modern conference room.

Smplrspace brings portfolio reporting into geographic context. View buildings on an outdoor map and compare performance across markets, regions, and locations.

Compare sites, spot regional patterns, and make smarter portfolio decisions with location fully in context.

Points of interest

Transport networks and highways

Competitor locations

Micro-markets or custom zones

About portfolio intelligence
Why teams choose Smplrspace

Reporting that understands space

Reporting in real estate needs spatial context, cross-team alignment, and portfolio scale. Smplrspace is built specifically to support complex portfolios and organizations with many teams and stakeholders.

Spatial first, always

Reporting is built on digital floor plans, not charts. Data is shown where it happens, inside buildings and across portfolios.

Shared across teams

Different teams get the views they need, in the same environment. Reporting stays aligned without siloed tools.

Built for decisions

Reports support real decisions, not just metrics. Spatial context makes trade-offs and outliers clear at a glance.

Scales naturally

From a single building to large portfolios, indoor and outdoor reporting work together as your needs grow.

Solutions For owners & operators

From insight to action

Smplrspace turns reporting into a shared view teams can act on. Spatial context makes results clearer, easier to compare, and easier to communicate across a portfolio.

Start with reporting pilot, prove value, then scale further when you’re ready. It’s also the fastest way to evaluate Smplrspace.

Owners & operators solutions
CBRE
Our client has been satisfied with Smplrspace’s visualization, replacing cumbersome Excel reports. Property Manager and Leasing Teams are able to take advanced and planned action on all spaces.
Taranjot Gulati
Taranjot Gulati
Head of Clients Solutions - Asia
JVM
Data alone doesn’t inspire action, understanding does. Smplrspace is a powerful translator, bridging how information is seen, understood, and ultimately acted on across an organization.
Talisa Dever
Talisa Dever
Vice President of Revenue and Performance
Switch Automation
Effective visualization of occupancy has helped our client achieve US$ 2.4M in savings over a one-year period.
Deborah Noller
Deborah Noller
CEO
Quick and easy to start

How reporting works with Smplrspace

Smplrspace reporting is delivered as a structured, collaborative process designed for owners and operators.

Smplrspace is agnostic to data providers. Access to reports can be shared across departments, stakeholders, and business lines.

Book a pilot call
1

Define scope

Identify buildings for digitization and agree on reporting goals and success criteria.

2

Provide inputs

Share selected floor plan images with scaled dimensions, along with your datasets, using the provided spreadsheet templates.

3

Configuration and preparation

The Smplrspace team digitizes spaces and configures reports based on agreed use cases and desired outcomes.

4

Training and handover

Teams are onboarded and trained to understand, use, and share reports confidently across the organization.

5

Ongoing updates

Data can be updated on a regular cadence, for example monthly, using the same reporting structure.

Clarity for every type of asset

Smplrspace is suitable for any asset type in your portfolio. Dive into the dedicated pages for retail, office, and multifamily to see how Smplrspace supports each one.

Multifamily

Multifamily

Track performance, support renewal strategies, and strengthen leasing decisions with clear spatial insight across your portfolio.

Learn more
Office

Office

Connected visibility for modern workplaces. Understand space usage, occupancy, movement, and tenant experience across floors and buildings.

Learn more
Retail

Retail

Leasing, tenancy, footfall, and operational data brought together in one spatial view, helping teams make confident decisions in complex retail environments.

Learn more

FAQs

Questions come up when exploring a new platform. Here are answers to the most common ones. Contact us if you need more detail or want to discuss your setup.

Contact us
Where does the data for the reports come from?

Data can come from internal systems, CRMs, spreadsheets, or third-party providers. Smplrspace is data-source agnostic.

How often can reports be updated?

Updates can follow your preferred cadence, for example monthly or quarterly.

How large can portfolios be?

Smplrspace supports portfolios ranging from single buildings to large, multi-site or cross-country estates.

Can reports be shared across teams?

Yes. Access can be shared across departments, stakeholders, and business lines.

Can reporting later be integrated into other systems?

Reporting can be used to validate how a future integration might look and behave. Many teams use reporting as a way to test data structure, visualization, and workflows before deciding on deeper integrations.

Start with a reporting pilot

Reporting is often the fastest way to evaluate Smplrspace in a real operational context. A reporting pilot allows teams to see value quickly before committing to broader integration or rollout.

Pilots typically run 8–16 weeks

Focused on a defined subset of the portfolio

Based on real operational and business questions

Deliver tangible reports and insights

Book a call

Solutions for owners and operators

Streamline data across regions and asset types at portfolio scale, enabling smarter, strategic decisions for every stakeholder.

Learn more
Join our newsletter

Be the first to hear about product updates, new features, and what’s next for smarter property data.

One more step: please verify your email address.
Something went wrong while submitting the form.
Redefining communication about spaces.
Contact salesPricing
Platform
Interactive 2D & 3D floor plansReporting & business intelligenceIntegrate & embed SmplrspaceReal estate portfolio intelligence
Services
Floor plan digitizationData mapping
Solutions
by organization
Owners & operatorsSoftware companies
by asset type
RetailCommercial officeMultifamily
Resources
Why SmplrspaceHelp centerSupportWhat's newSystem status
Developers
Developer quickstartDeveloper docsAPI referenceLive integration examples
About
CompanyCareers
©
2026
Smplrspace | All rights reserved.
Privacy policyTerms of useCookies
Smplrspace status